
Are consumers in the mood to buy or uncertain to buy this coming week?
Will the marketing event my client has scheduled in two weeks be a hit or a miss?
Should I use my “Buy Now” Ad or my “Brand Equity” Ad this week?
How are my client’s sales performing the week when the Consumer Sentiment Index is down? And when the Consumer Sentiment Index is up?
Analysts at media agencies frequently wonder how economic indicators can be used to make more informed business decisions on behalf of their clients.
This post investigates a general technique for modeling economic indicators using a combination of time series forecasting methods and Google Trends data. For concreteness we focus on a specific indicator (UMCSI), but the general method is applicable to many other indicators such as: Weekly Initial Claims for Unemployment, Monthly Retail Sales, Home Sales, and so on.
I was particularly motivated to use the Consumer Sentiment Index (UMCSI) because (as its name alludes), it has to do with consumers, because of its ability to forecast short-term consumer spending, it is often seen as a leading economic indicator, and because the estimates are not reported in real time (the data is delayed to the public by one month, according to the University of Michigan). This last point is what we are going to address on this post.
Below is what I’ll cover:
A definition of Economic Indicators
A brief overview of the Consumer Sentiment Index from the University of Michigan (UMCSI)
A machine learning-driven approach that addresses the shortcomings of the UMCSI
Some ideas on how the UMCSI can be used in strategic planning and buying/activation.
What are Economic Indicators?
Economic indicators are important statistics, used mainly by Economists, that measure the health of the economy and its likely future direction. Some examples of Economic Indicators are Consumer Price Index, Unemployment and Inflation rate.
Overview of the UMCSI
The UMCSI is a survey run by the University of Michigan that measures the feelings and confidence levels of US consumers about the state of the economy at the time the survey measurements are taken. It also gives us an indication in terms of how consumers, on average, feel about their financial situation.
The UMCSI is usually followed by Economists, Policymakers, Investors, and Businesses to anticipate where the economy is heading, and it is very useful in retail, financial services, automotive, real estate, and durable goods, among other sectors. After all, two thirds of the GDP comes from private consumption, which is a key building block of the national economy.
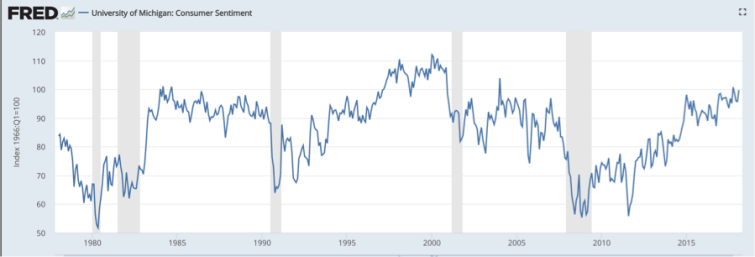
Graph above: Surveys of Consumers, University of Michigan – Source: FRED https://fred.stlouisfed.org/
A machine learning-driven approach that addresses the shortcomings of the UMCSI
Relationship between Consumer Sentiment and the state of the economy
Consumer sentiment and consumer spending are linked to the health of the economy when the surveys are taken (that is, if consumers feel optimistic, then consumers buy; during economic uncertainty, consumers postpone their purchases [and advertisers spend less on media; after all, the gravitational force of consumers is marketing]).
Business decisions are impacted by reporting delays
If we manage to understand the feelings and confidence levels at present time, this information could be instrumental to use in all aspects of marketing such as in media.
Even though the University of Michigan issues preliminary results of the Consumer Sentiment Index towards the middle of each month, the total sample when surveys are completed at the end of the month is about 500 interviews.
Bringing the Consumer Sentiment Index to present time
There is the belief that online behavior (in the present time) is an indicator of offline reality (in the present time), and since the Consumer Sentiment Index is obviously tied to consumption, search engine data [such as Google Trends] is a good proxy to nowcast consumer sentiment.
Google Correlate (https://www.google.com/trends/correlate) is another useful data source, however, Google Company stopped refreshing this particular data since March 2017, and the future of this tool is very uncertain.
Requirements to nowcast the UMCSI
Access to historical UMCSI data (free) https://data.sca.isr.umich.edu/
Access to historical Google Trends data from categories and search terms that are meaningfully related to consumption, economic and finance information (free) https://trends.google.com/trends/explore
Access to “R” Statistical software and to the “Bayesian Structural Time Series” (BSTS) software package (both are free) https://cran.r-project.org/
I decided to use BSTS because this software package was “specifically” created as a nowcasting modeling system using Google Trends data (although you can use it in several other scenarios with other data).
In terms of Google Trends, behind this data, there are billions of search queries, and even though the data is aggregated and indexed, it is fairly robust (especially the search categories).
Due to its behavioral nature, search data is a more credible source than panel-based indicators, and search has the intent quality “built-in” that surveys are unable to capture.
The topic of nowcasting is not new; to gain more perspective I encourage you to read the following paper from “Scott & Varian” (http://people.ischool.berkeley.edu/~hal/Papers/2013/pred-present-with-bsts.pdf); my angle on this post is more on its application to marketing overall, especially now that Ad-Tech is facilitating real-time media activation.
The Bayesian Structural Time Series
BSTS is a powerful and well documented software package that can be found in “R“ Statistics package. The system is equipped on one side, with a Time Series module that helps us detect and isolate Trend & Seasonality on the Consumer Sentiment Index, and on the other side it includes a Regression facility which is instrumental in quantifying the predictive effects of the search engine data that are used as explanatory variables in the model. Bayesian techniques then blend everything together.
In terms of the guts of the software package, BSTS uses a host of statistical methods to model time series data:
It uses “state space models” to divide the data into Trend, Seasonal, and Regression components.
It uses Bayesian “Spike and Slab” regression to choose which variables should be included.
The model is learned using Markov Chain Monte Carlo (efficiently implemented using the Kalman filter), which produces a large ensemble of models instead of a single model.
The model ensemble does two things for you:
First, it correctly captures modeling uncertainty (i.e. not knowing for sure which predictors to include).
Second, averaging predictions over the ensemble is a convenient way to implement “Bayesian Model Averaging,” which offers improved forecasts relative to the single “best” model in the ensemble.
An example using the Consumer Sentiment Index and BSTS
The objective of my exercise was to anticipate the direction of the trend (up or down) in August 2018, using Google Trends as explanatory variables. I started with 265 search trends.
Before all the data was loaded onto the Bayesian Structural Time Series software package, the Google Trends data had to be both detrended and deseasonalized.
To simplify things, several iterations were run in advance, and many trends were excluded until the final number was reduced to 18 predictors; essentially, always striving for parsimony and avoidance of both multicollinearity and spurious correlations. Common sense in “variable selection” plays an important role here.
Below are some screenshots of the example I followed using BSTS:
Plot of original Consumer Sentiment data
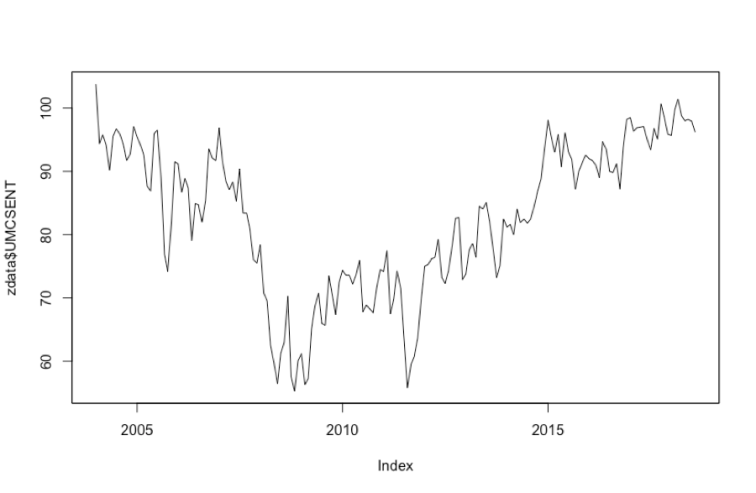
Above, monthly data of the UMCSI from Jan 2004 through July 2018.
The data clearly exhibits a lot of variability (especially because of the 2008-2009 recession and its subsequent effects). Seasonality is very weak.
Trend & Regression Decomposition of the Consumer Sentiment Index
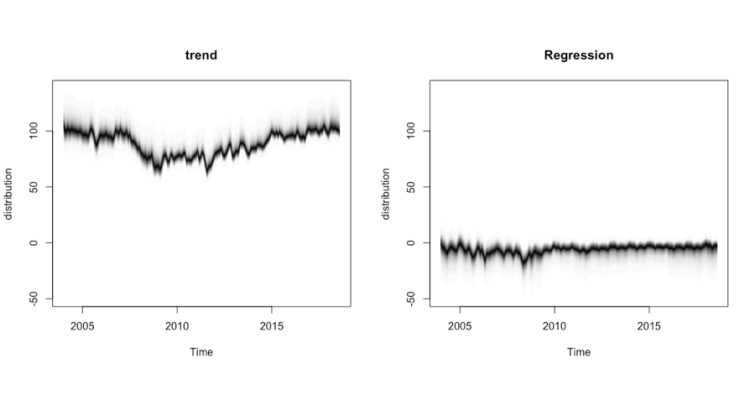
Above, the Kalman filter isolated the trend and the regression parts of the UMCSI.
Since the Consumer Sentiment Index did not exhibit a strong seasonal component, the data was not deseasonalized by the filter.
Average Coefficients (after optimizing the final set of predictors)
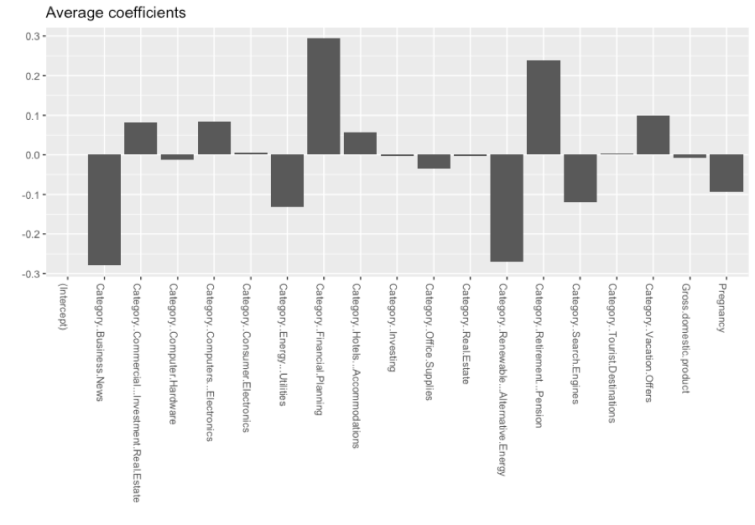
The chart above displays the average coefficients for the selected variables of the algorithm.
BSTS finds top four predictors out of 265 search categories & queries
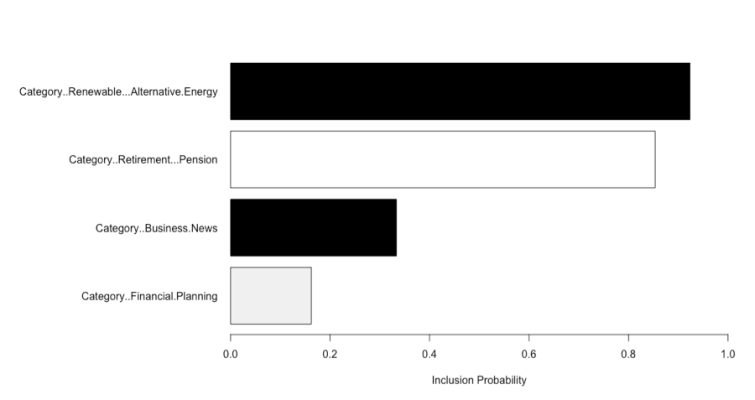
Above, top four predictors for UMCSI with a marginal probability greater than 15%.
Bars show the probability of inclusion (white shading: positive relationship with the UMCSI; black shading: negative relationship with the UMCSI).
Search categories with longer bars imply a higher proportion of them in the estimated models.
The top predictor is the category: “Renewable & Alternative Energy” (negative). The main search terms associated to this category are: “energy’, “solar”, “wind”, “solar panel”, “solar power”, etc.
The second predictor of UMCSI is the category: “Retirement & Pension” (positive). The main search terms associated to this category are: “ira”, “retirement calculator”, “roth ira”, “pension”, “social security”, “401k”, etc.
The category “Business News” (negative) is the third predictor of the UMCSI.
The main search terms associated to this category are ”net worth”, “finance”, “finance yahoo”, “dow jones”, “aapl”, “cnbc”, “Bloomberg”, ”wall street”, “forbes”, etc.
“Financial Planning” is the forth and last predictor of the UMCSI. The main search queries linked to this category are: “schwab”, “charles schwab”, “fidelity”, “irs”, “wells fargo”, etc.
Nowcast (last month of the Time Series)
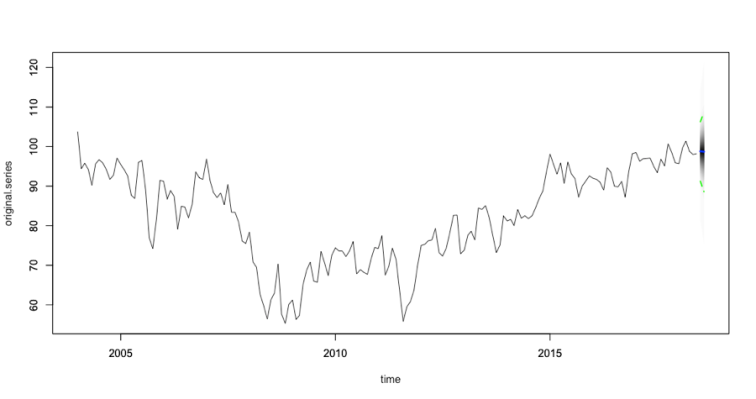
Above, BSTS nowcasts that in the month of August 2018 the Consumer Sentiment would go down (blue line; apologies, it can hardly be seen!). To validate, I waited until the final UMCSI data became available, and the University of Michigan reported that the Consumer Sentiment Index in July was 97.9 and in August 2018 was 96.2; so it went down indeed.
Advice to improve predictions
I know, even though the nowcast is right, the prediction intervals of the graph above are a bit wide. So here are some ideas to build more robust models that can accurately predict the present: we continually have to include search categories that are aligned with the consumer expectations at a given point in time (each month the top search predictors might be different due to different dynamics). Also, analysts have many tools and techniques at their disposal to make more accurate forecasts. For instance,
different trend models can be used (BSTS is flexible and offers quite a few options to try)
it is recommended to experiment with weaker and/or stronger priors when building the models
Building a Naive model to use it as a baseline would be a good idea
the identification of interactions and non-linear relationships among the data is something you have to pay careful attention to
Benefits of using economic indicators (such as the UMCSI) in marketing:
Perhaps one of the most important benefits of nowcasting the UMCSI is its ability to anticipate inflection points which everybody agrees are hard to predict. This allows you to better inform and efficiently activate addressable/RTB advertising. Nobody likes to waste ad dollars when consumers are not in the mood to buy.
To ensure your brand’s marketing activities or special events that are scheduled to happen the third week of the month will be successful. As a reminder, Google Trends is available in monthly, weekly, and other intervals; so, you could build a model that nowcasts the Consumer Sentiment any week of the month.
Programmatic platforms and mobile-location providers could monitor this indicator, and this “extra” economic data point will help them with their real-time decisions.
If you want to refresh your Market Response Models, a contemporaneous Consumer Sentiment indicator could be used as an external driver.
To stay ahead of the herd and monitor, anticipate and react to your unexpected competitor’s efforts.
For better alignment of media buying to stages of the decision journey. As an example, a contemporaneous UMCSI could help determine the ideal type of creative ad to run. If the index on a given week is down, perhaps an “Equity” ad is better than an ad with a “Buy Now” CTA.
It can be used as a coincident indicator on your client’s dashboards along with media, brand performance data and other metrics.
It could be an input for Purchase Intent models. More on this in my next post.
It can take into account Geography (as granular as DMA-level). This can inform local market spend allocations and also allows you to combine this indicator with other sources (such as BDI/CDI data, 1st party data, 3rd party data) for enhanced insights.
To test your hypotheses. Some examples:
Is there evidence that suggests that during the weeks when consumers have a positive outlook the levels of engagement with media (TV, Social Media…) are higher?
What is the relation between weekly sales and the weeks with a positive Consumer Sentiment? Or with a negative Consumer Sentiment?
Summary
Economic indicators such as UMCSI, Unemployment and Retail Sales, are important statistics that can be incorporated in marketing to help make more informed business decisions.
Time lags are an issue for Economic Indicators, but as we explained on this post, Bayesian Structural Time Series is a statistical package that allows you to bring these indicators to present time.
Search Engine data such as Google Trends data is a useful source to use as explanatory variables for the models you build with the BSTS package.
Most of the benefits that contemporaneous Economic Indicators bring to media agencies and ad tech companies are related to the fact that with the rapid advancements in technology, media activation and access to granular data now happens automatically and in real-time.
Food for thought…
Do you think that we should be ready to migrate from survey-based Economic Indicators to Behavioral indicators driven by digital footprints and Machine Learning? I would love to hear your thoughts and comments.
Lastly…
I want to express gratitude to Dr. Steven Scott for his guidance on the Bayesian Structural Time Series package and for his overall contributions to the post.