Introduction
Food allergies trigger negative immune responses to specific foods, affecting 8% of children and 4% of adults in the U.S. Sources such as the FDA and Mayo Clinic support these findings. Consequently, Google Search Trends and clinical data from the Food Allergy Institute (FAI) reveal insights into public search behaviors and their alignment with clinical patterns.
Google search trends and Food Allergy Institute data correlation
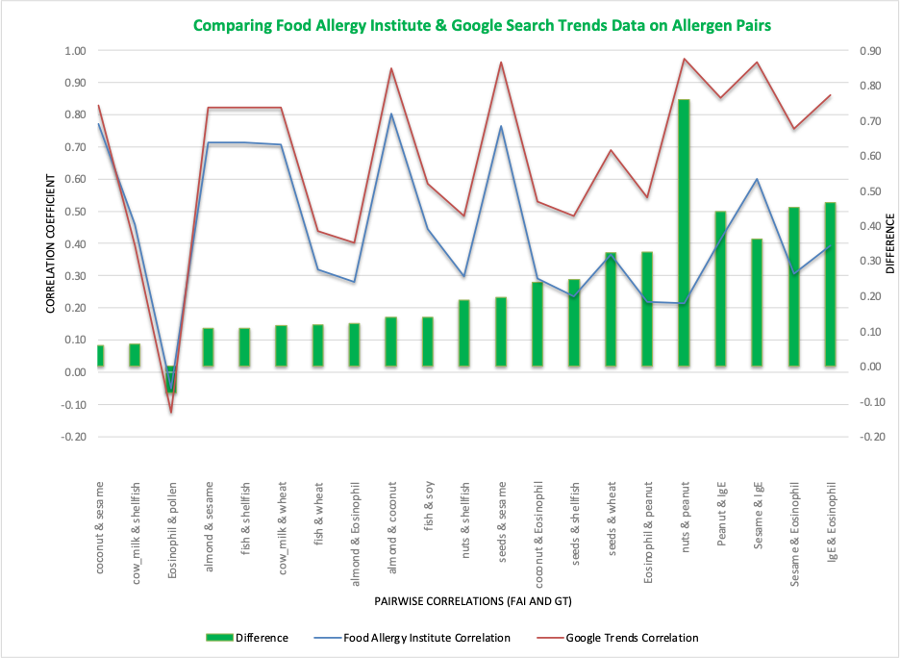
Through data-driven methods, the Food Allergy Institute [FAI] aids in understanding and treating food allergies. Their Tolerance Induction Program (TIP) customizes immunotherapy based on extensive patient assessments. We used FAI data and Google Search Trends to perform a Spearman correlation analysis. This exploration sought to determine the relationship between public searches and clinical data. We focused on health-related searches to filter out irrelevant data. Importantly, the correlation coefficient (r=0.71) indicates a strong link, showing that search behaviors often mirror real-world allergy trends. For more detailed information about the Food Allergy Institute visit their website, and the details of the paper and its methodology can be found on PLOS ONE.

Fig. 1 – Comparing Food Allergy Institute & Google Search Trends Data on Allergen Pairs. Overall Correlation r=0.71
Machine Learning models to predict food allergy trends
Encouraged by the promising correlations, we developed two machine learning models: Random Forest and Gradient Boosting. These models analyze food allergy trends based on over 140 search terms. They cover stages from awareness to management, using Google searches as indicators of public concern.
The “focus variable” of our models was a composite search string that included allergies to the following foods:

Fig 2 – Top 8 Food allergenic substances that were used as a Dependent Variable.
Below are the final model’s performance metrics and predictors:

Figure 3 – Machine Learning Regression Models

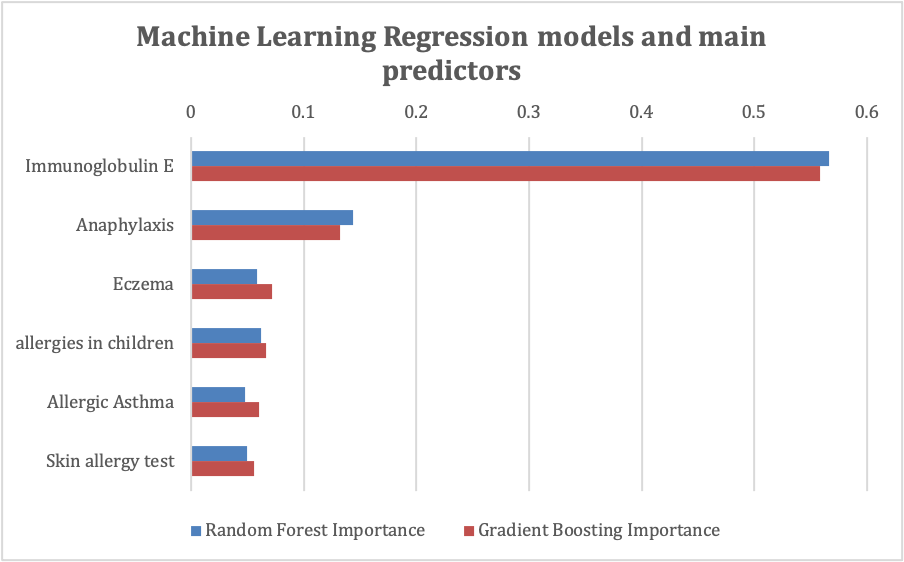
Fig. 4 – Machine Learning regression models and main predictors
Gradient Boosting emerges as slightly more effective and predictive model. This is evidenced by its lower Mean Squared Error, Mean Absolute Error, and Root Mean Squared Error, as well as its higher R² Score.
Key findings and regional differences in food allergy searches
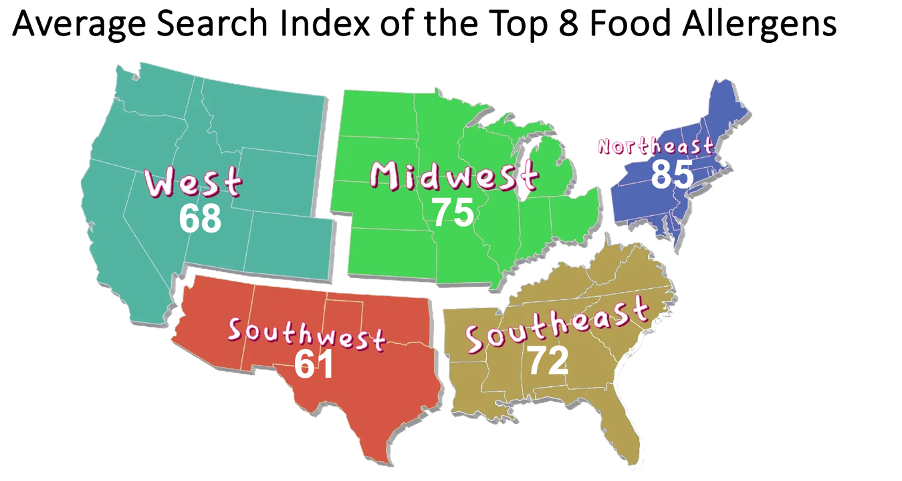
Our analysis pinpointed significant predictors of food allergy searches: Immunoglobulin E (IgE), anaphylaxis, and eczema. These closely align with clinical markers. Additionally, other key factors include allergies in children, allergic asthma, and skin allergy tests. Furthermore, our research also highlights how food allergy concerns vary regionally. The Northeast U.S., for example, shows higher levels of searches related to food allergies, indicating higher awareness or prevalence in that area.

Fig 5. – Average Search Index of the Top Food Allergens
Conclusions
By using Google Search data alongside professional health data, we can better track and anticipate food allergy trends. This not only helps in managing allergies more effectively but also supports public health efforts by targeting educational resources where they’re needed most.
This approach has proven effective in identifying emerging trends and refining health strategies to better serve the public’s needs.
All insights presented in this post were independently gathered and analyzed by Beanstalk Insight, without any external commission or sponsorship.
About the author
Francisco J. Rodríguez is a marketing research executive and the founder of Beanstalk Insight. He is a seasoned media agency veteran with over 25 years of experience in communications planning, business strategy, insight, analytics, branding, and measurement. Francisco has collaborated with a diverse range of advertisers, delivering actionable recommendations that drive brand growth and profitability. Francisco can be contacted at francisco@beanstalkinsight.com
